마이크 트라웃이 항상 꾸준한 모습을 보여주는 탓에 우리는 그가 얼마나 대단한지를 자주 잊어버리는 듯 하다.
시즌이 1/3이나 지난 6월 1일 기준으로 팬그래프 사이트에 올라온 글 중 개막 이래 트라웃을 다룬 글은 단 하나 뿐이다. 심지어 그 글은 브라이스 하퍼가 트라웃보다 뛰어난 선수라는 내용을 다뤘는데, 그 글이 올라온 후 하퍼의 타율은 .207에 그치고 있으며 타자의 상대적인 생산성을 평가하는 척도인 조정 득점생산력(리그 평균은 100)에서는 115를 기록 중이다. 반면 트라웃은 .641의 장타율과 198의 조정 득점생산력을 기록 중이다.
트라웃은 올 시즌도 MVP에 걸맞는 활약을 이어가고 있다. 타격, 주루 모두 메이저리그 전체 탑 3 수준이고 출루율은 전체 7위, 장타율은 전체 20위 내에 든다. 팬그래프의 예측 시스템에 따르면 트라웃은 데뷔 5년차인 올 시즌 9.7의 WAR을 기록할 것이다. 이 예측 대로라면 데뷔 이래 5년간 트라웃의 총 WAR은 47.3에 달하는데, 이는 메이저리그 역대 타자들의 첫 5년간 기록 중 9번째로 뛰어난 활약상이다. 심지어 트라웃은 이제 만 24세에 불과하다.
이 슈퍼스타의 활약을 지켜보는 건 즐거운 일이다. 최근 그의 발전된 모습 5가지를 간략하게 짚어 보자.
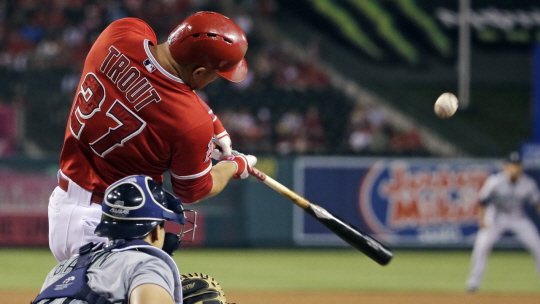
타석에서 더 공격적인 자세로 많은 컨택을 만들어내고 있다.
트라웃은 데뷔 이후 가장 높은 스윙율과 컨택율을 기록 중이다. 스윙율은 2%, 컨택율은 3%가 늘었는데, 각각은 큰 차이가 없어 보일 수 있지만 이 두 가지는 합쳐지면 매우 큰 차이이다. 두 수치를 곱하면 모든 투구 중 컨택이 된 투구의 비율을 구할 수 있다.
작년 트라웃의 ‘총 컨택율’은 30.5%였다. 올해는 더 많은 스윙과 컨택을 통해 이를 33.6%끌어올렸는데, 3%의 상승은 100명의 타자들이 기록한 상승폭 중 9번째로 큰 수치이다. 다시 말해 마치 2012-13년의 기록처럼 삼진은 줄었고 인플레이된 타구는 늘어났다. 또 주목해야 할 점은 트라웃이 볼에 스윙한 비율은 늘지 않았다는 점이다. 트라웃이 스윙을 늘린 건 모두 존 안으로 들어오는 공에 대응한 결과이다. 게임에서나 나올 법한 소리지만, 이런 능력에다 트라웃은 스피드까지 갖춘 이상적인 타자이다.
더 이상 내야안타에 의존하지 않는다.
2012년부터 15년까지의 첫 4시즌동안, 트라웃은 누구도 넘보지 못할 법한 총 96개의 내야안타를 기록했다. 반면 올해는 미겔 카브레라와 동률인 1개를 기록 중인데 저스틴 보어(마이애미의 120kg 거구 1루수)보다도 낮은 기록이다. 리그 최다 기록은 15개에 달한다. 트라웃의 땅볼 타구 자체는 데뷔 이래 가장 많이 나오고 있다는 점을 감안하면 내야안타도 당연히 많아야 한다는 결론이 나온다. 그러나 실제로 그렇지 않은 이유를 짐작해 보자면, 불운과 스피드 감소라는 두 가지가 가장 먼저 떠오른다.
미겔 카브레라가 내야안타를 치는 장면을 상상해 보면, 운이 얼마나 중요한지는 짐작할 수 있다. 그러나 이 중 일부는 관련없는 데이터이기도 하다. 스피드 감소는 무시 못할 요소이다. 제프 설리번이 2014 시즌 말에 몇몇 스피드 감소 증상을 찾아내기도 했다. 설리번은 5번의 내야안타와 더블플레이 장면을 통해 타석에서 1루까지 도달하는 시간을 측정했다. 트라웃의 데뷔 시즌에는 스탯캐스트 데이터를 사용할 수 없기 때문에, 나 또한 설리번처럼 5가지 장면을 측정했다.
트라웃의 1루까지 전력질주 평균 소요시간
2012년 : 3.98초
2013년 : 4.05초
2014년 : 4.13초
2016년 : 4.18초
내가 체크한 가장 빠른 기록은 4.14초로 설리번이 2014년에 측정한 평균 기록보다 더 느리게 나타났다. 트라웃은 올해 공격적으로 도루를 감행하면서도 도루자는 잘 기록하지 않는 중이다. 그러나 도루는 단순히 스피드만이 아니라 스타트, 슬라이딩, 상대 배터리 등 훨씬 많은 요소가 영향을 주는 기록이다. 트라웃의 1루 도달 소요시간을 보면 데뷔 시즌에 비해 0.2초가 느려졌음을 알 수 있다. 이는 당연히 내야안타 감소의 원인일 것이다.
트라웃을 상대로 한 패스트볼 승부가 줄어들었다.
많은 설명이 필요한 부분은 아니다. 선수 생활 내내 트라웃을 상대로 한 투구의 40%는 포심패스트볼이었다. 2014년에는 44%였는데 마찬가지로 큰 차이는 아니다. 반면 올해는 크게 줄어든 34%만의 포심을 상대하고 있는데, 투심이나 싱커는 커리어 평균 수치와 크게 차이가 없다. 즉 슬라이더, 커터, 커브를 데뷔 이래 가장 많이 상대하는 중이다. 재미있는 부분은 트라웃이 올해 데뷔 이래 패스트볼 이외의 구종을 상대로 가장 많은 컨택을 만들어낸다는 것이다.
높은 공에 강한 타자로 변하는 중이다.
작년 트라웃이 높은 공 약점이 널리 알려졌던 걸 감안하면, 올해의 기량발전 중 가장 인상적인 부분이다. 2014-15년동안 상대팀은 트라웃의 높은 공 약점을 집중적으로 공략해 왔다. 지난 시즌 초 트라웃을 상대로 높은 패스트볼 유인구가 늘어났지만 트라웃은 별 문제를 겪지 않았다. 결국 새로운 전략이 시원치 않자 상대팀은 다시 높은 스트라이크 존을 공략하기 시작했는데, 트라웃은 이제 높은 공이 들어오면 즐겁게 받아치고 있다.
위는 2014-16년간의 트라웃의 코스별 장타율이다. 올해 높은 공에 제대로 대응하고 있음이 나타난다. 아래는 같은 기간 트라웃을 상대로 한 패스트볼의 로케이션 통계이다.
올해 트라웃을 상대로 한 패스트볼 승부는 낮은 코스에 집중되고 있다. 데뷔 초기 낮은 공에 강했던 모습을 감안하면 사실상 제자리로 한 바퀴 돌아온 것이다.
강력한 송구 능력까지 장착했다.
트라웃은 높은 코스 패스트볼 말고도 송구 능력이 약점으로 지적되어 왔다. 데뷔 이후 지금까지 에인절스가 10점을 손해봤다고 집계될 만큼, 몇 년 간 트라웃의 수비 능력을 평가할 때 발목을 잡는 요소였다. 베이스볼 인포 솔루션에 따르면 트라웃은 올 시즌 전까지 통산 7번의 어시스트를 기록했다. 또한 데뷔 이후 리그 전체 중견수가 주자의 추가진루를 54%만 허용한 데 비해 트라웃은 60%를 허용하며 평균에 미치지 못하는 기록을 보였다.
그러나 올 시즌 트라웃은 이미 3번 주자를 저격해 개인 통산 최다 어시스트 기록과 동률을 이뤘고 주자의 추가진루는 50%만 허용했는데 리그 전체 중견수 중 상위 1/3에 해당하는 기록이다.
더 말할 것도 없을 만큼 훌륭한 선수이지만, 그렇다고 그의 훌륭한 점들을 하나라도 뺴놓아서는 안 된다. 트라웃의 놀라운 플레이를 놓치지 말고 가능한 자주 감상하도록 하자.
원문 기사 - 어거스트 페이거스트롬 / MLB.com
<원문>
Constantly evolving Trout is still as great as ever
Improvements in arm strength, plate discipline, have elevated game
We're doing it. It's happening again. We're forgetting about Mike Trout. You know how I know we're forgetting about Trout again? It's June 1, one-third of the way through the baseball season, and on FanGraphs, Trout has been tagged in exactly one post since Opening Day. It was a post about whether Bryce Harper is better than him. Since that post, Harper has hit .207 with a 115 Weighted Runs Created Plus, where 100 is "league average." Trout has slugged .641 with a 198 wRC+.
For the year, Trout has been the most valuable position player in baseball. He's been a top-three bat mixed with a top-three baserunner. Trout is seventh in the league in on-base percentage, while also ranking among the league's top 20 power hitters. He's projected to finish the season with 9.7 FanGraphs Wins Above Replacement, which would give him 47.3 WAR over his first five full Major League seasons, and would be the ninth-best five-year peak of any hitter ever -- and Trout is still only 24.
Since we need to pay better attention to Trout, we should be thrilled to get up-to-the-minute updates on the developments of his game. Let's now briefly discuss five things that are different about Trout.
He's more aggressive and is making more contact.
Trout is currently running both the highest swing rate and the highest contact rate of his career. The differences may seem small -- a two-point increase in swings, a three-point increase in contact -- but coupled together, it's actually a pretty substantial difference. By multiplying the two figures together, we can get an overall percentage of pitches that led to contact.
So, last year, Trout's "total contact percentage" was 30.5 percent. This year, with more swings and more contact, it's up to 33.6 percent. That three-point increase is the ninth-largest among 100 qualified batters from last year to next. In other words: fewer strikeouts (he's back to that 2012-13 level) and plenty more balls in play. It's important to note, too, that Trout's chase rate hasn't budged. All of the extra swings are coming against hittable pitches inside the zone. All of this, particularly for a player with Trout's speed, seems like a good thing, although it sure is weird that...

He's no longer reaching on infield hits.
From 2012-15 -- Trout's first four full seasons -- he recorded infield hits at a rate like no one else in baseball. A higher percentage of Trout's grounders went for infield hits than any other player in baseball during that time, leading to 96 hits. This year, he has one, as many as Miguel Cabrera; he's produced a lower percentage than Justin Bour. The league leader has 15. Trout is actually pulling more grounders than he ever has in his career, which might reasonably lead to more infield hits, so we're left with two explanations, both of which I'd wager are in play: luck and declining speed.
A big part of getting an infield hit is getting lucky -- how do you think Miggy got his? -- and I'd guess some of this is just noise. But we can't ignore the possibility of declining footspeed, toward which Jeff Sullivan presented some evidence late in the 2014 season. In that post, Sullivan recorded some home-to-first times on infield hits and double plays, watching five plays each. Though we have Statcast™ data, we didn't for the first years of his career, so to keep things consistent, I also watched five plays, and will add to Sullivan's work below:
Trout average max-effort home-to-first time
2012: 3.98 seconds
2013: 4.05 seconds
2014: 4.13 seconds
2016: 4.18 seconds
The fastest time I clocked was a 4.14, slower than the average that Sullivan observed in 2014. Trout's been a more aggressive (and efficient) basestealer this year, but stealing a base is about plenty more than just speed -- technique and the opposing battery play a huge role. Looking just at the times when Trout's really legging it out, he's lost roughly two-tenths of a second off his home-to-first time since his rookie year, and it's costing him some infield hits.
He's seeing fewer fastballs.
This one doesn't need much explaining. For his career, Trout has seen four-seamers 40 percent of the time, as high as 44 percent in in 2014. This year, it's all the way down to just 34 percent. His rate of two-seamers and sinkers seen is mostly unchanged from his career norm. Sliders, cutters, curves and changes are all at career highs. The fun part is, Trout is making more contact against breaking and offspeed pitches than he has since his rookie year.
He's becoming a... high-ball hitter?
This might be the most interesting Trout development, because it was the one covered most extensively last year. You know the story by now: Trout's one weakness was the high fastball, teams realized this in the offseason between 2014-15, Trout last year started seeing way more elevated fastballs, it didn't really matter. A logical line of thinking after the league's adjustment failed to yield positive results might be that things would just go back to normal. "Welp, that didn't work, might as well just go back to what we were all comfortable doing in the first place." Nope. Trout actually looks like he enjoys the high pitch now:

That's Trout's slugging percentage heatmap progressing from 2014-16. He's crushed the high pitch this year. And now, the location of the fastballs Trout has seen over those same four years:

Trout is actually getting pitched low in the zone now! How about that! It's come full circle.
He's turning his arm into a strength.
Trout's other weakness -- beyond the previously perceived weakness against elevated fastballs -- has been his arm. It's the main thing that's held down his defensive value over the years, costing the Angels roughly 10 runs since his debut. Coming into this season, Trout had registered just seven career outfield kills, as tracked by Baseball Info Solutions, and had allowed 60 percent of baserunners with an opportunity to advance to do so, with league average for a center fielder around 54 percent. This year, Trout has already registered three outfield kills, tying a career high, and has held opposing baserunners to a 50 percent advancement rate, which ranks in the upper-third of qualified center fielders.

Nothing more needs to be said, but everything needs to be said. Trout is just amazing, and this game is constantly changing, so watch him play baseball as often as you can, lest you miss something.
By August Fagerstrom / Special to MLB.com
SNS 기사보내기